Executive Summary
Not surprisingly, High-Risk Exchanges are more engaged in illicit activities than regulated exchanges. However, the size of these activities is staggering and potentially, troublesome for the legitimate industry to gain wider acceptance. However, there are signs that the problem is being addressed. Who and where are the biggest concerns for users and the industry?
High-Risk Exchanges (HREs) are defined as exchanges that require little or no user identity verification to transfer crypto-assets. The ease of use of such services makes them attractive for illicit agents such as drug marketplace or phishers. At a time when an American exchange, Coinbase is soon coming public and most Americans have to deal with cryptoasset exchanges that requires KYC and AML, it’s important for us to recognize that the rest of the world, as well as many North Americans, utilize these “un-regulated” exchanges to gain access to less traded assets and to facilitate illicit activity.
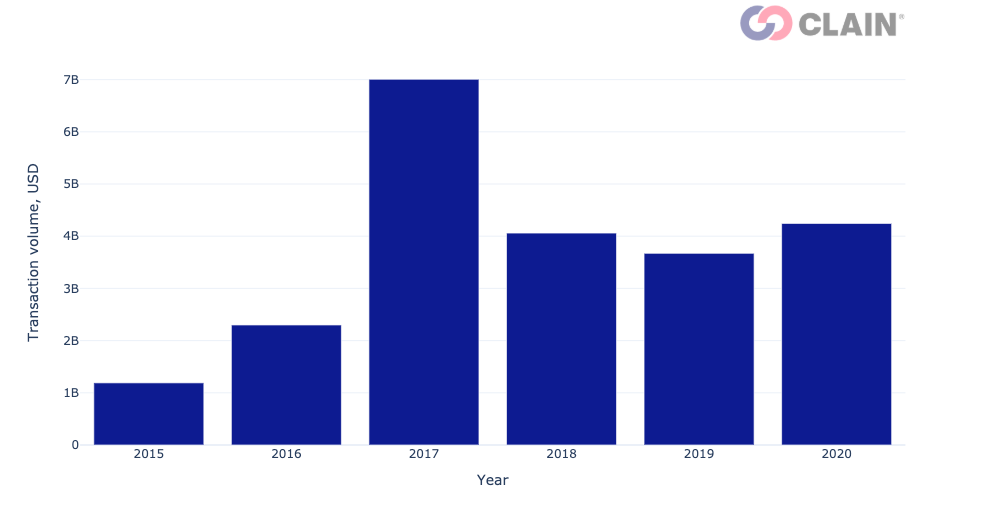
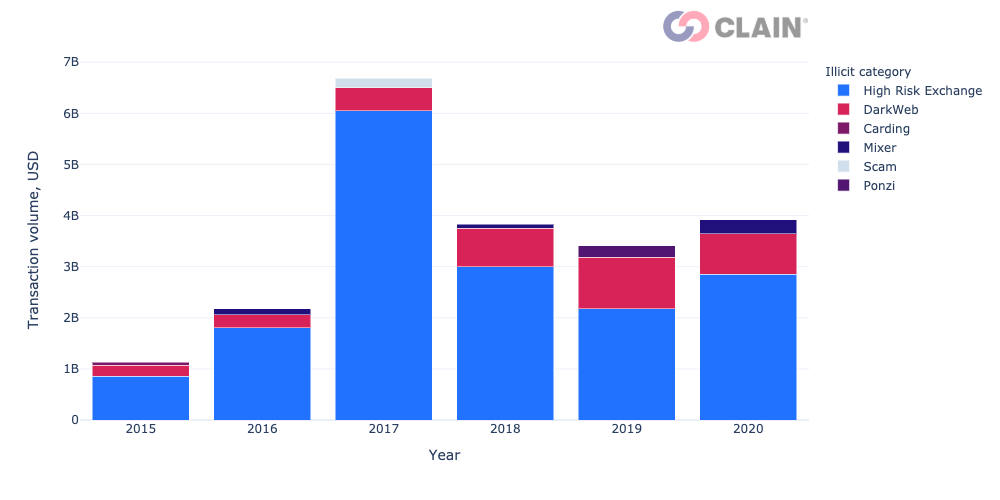
In 2020, the transaction volume of High-Risk Exchanges amounted to over 19.7 billion dollars - an uptick of 30% compared to 2019. The volume of illicit transactions of HREs summed up to 4.2 billion dollars in 2020, which is 16% more than in 2019. Over the last year, the share of illicit transactions on High-Risk Exchanges was 12 times higher than on regulated exchanges, where the percentage of transaction volume from illegal services was 1.7% in 2020.
DarkWeb and Mixers are among the most popular categories of HRE counterparties
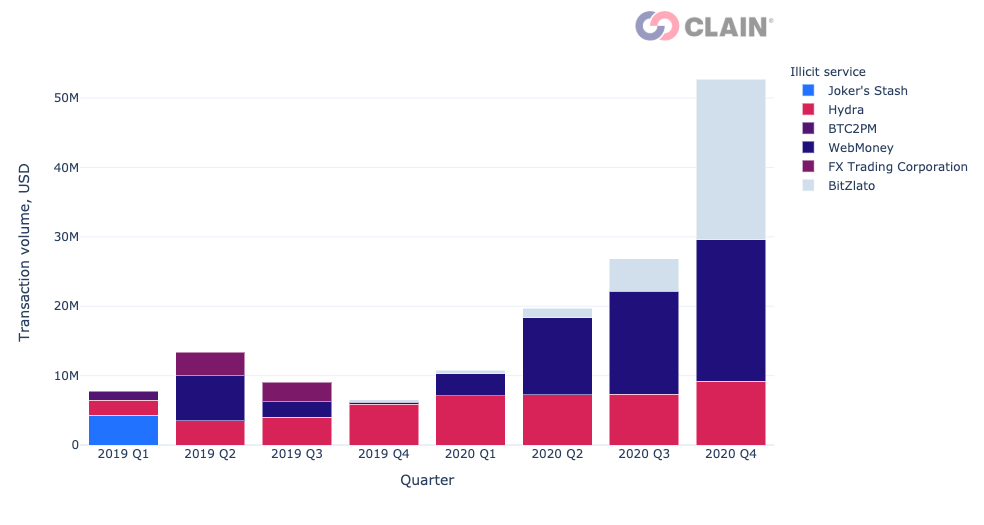
Top illicit categories of High-Risk Exchanges by transaction volume include DarkWeb services, Ponzi schemes, Mixers, and High-Risk Exchanges. The fund flow between DarkWeb services and High-Risk Exchanges amounted to over 798.5 million dollars. The majority of the flow coming from DarkWeb services to High-Risk Exchanges comes from Hydra.
Hydra is one of the largest marketplaces for drugs globally, with its target audience located primarily in Eastern Europe. Even though it started operating at the beginning of 2016, the platform gained popularity only by the end of 2016. The chart below illustrates how the usage of Hydra influenced the fund flows between HREs and DarkWeb services. In 2020, the transaction volume between HREs and DarkWeb services was around 3.5 times higher than in 2016.
As for the Ponzi schemes, the total transaction volume was 263 million dollars in 2020. That is 1.2 times higher than in 2019.
Fund flow between Hydra and HREs amounted to 772 million in 2020
In 2020, the transaction volume between Hydra and High-Risk Exchanges was 772 million dollars. For the last quarter of 2020, the transaction volume between HREs and Hydra increased by 21.7 million dollars. HREs are easy to use and lack AML/KYC policies, which undoubtedly look appealing for potential Hydra clients.
In 2020, median transfer for incoming and outcoming transactions between HREs and Hydra amounted to 51 and 137 dollars accordingly. We believe this difference has to do with the fact that incoming transactions to Hydra are mainly related to the purchase of drugs, while outcoming transactions are related to money laundering. Interestingly, median transfer amounts for Hydra and regulated exchanges are higher than between Hydra and HREs. For details, refer to the Hydra and High-Risk Exchanges part of the research.
Call for higher regulatory standards
Having lower registration barriers for users does reinforce illicit activity, e.g., fund flow between High-Risk Exchanges and Hydra. It makes KYC and AML measures necessary for preventing such unwanted activity.
Introduction
High-Risk Exchanges (HREs) are defined as exchanges that require little or no user identity verification to transfer crypto-assets. The ease of use of such services makes them attractive for illicit agents such as drug marketplace or phishers.
We have identified over 200 High-Risk Exchanges that are present on the Bitcoin and Ethereum blockchains. In this report, we aim to look into the behavioral patterns of the addresses that are related to High-Risk Exchanges. Potential illegal activity that may be mediated by HREs makes them interesting for research.
The report is structured as follows. We first compare how the behavior of HREs differs from the behavior of regular exchanges. Next, we dive into the exploration of illicit activity involving HREs. Then we look at the distribution of jurisdictions for HREs. Refer to Appendix for details on how the fund flow values are computed.
Are High-Risk Exchanges like regular exchanges?
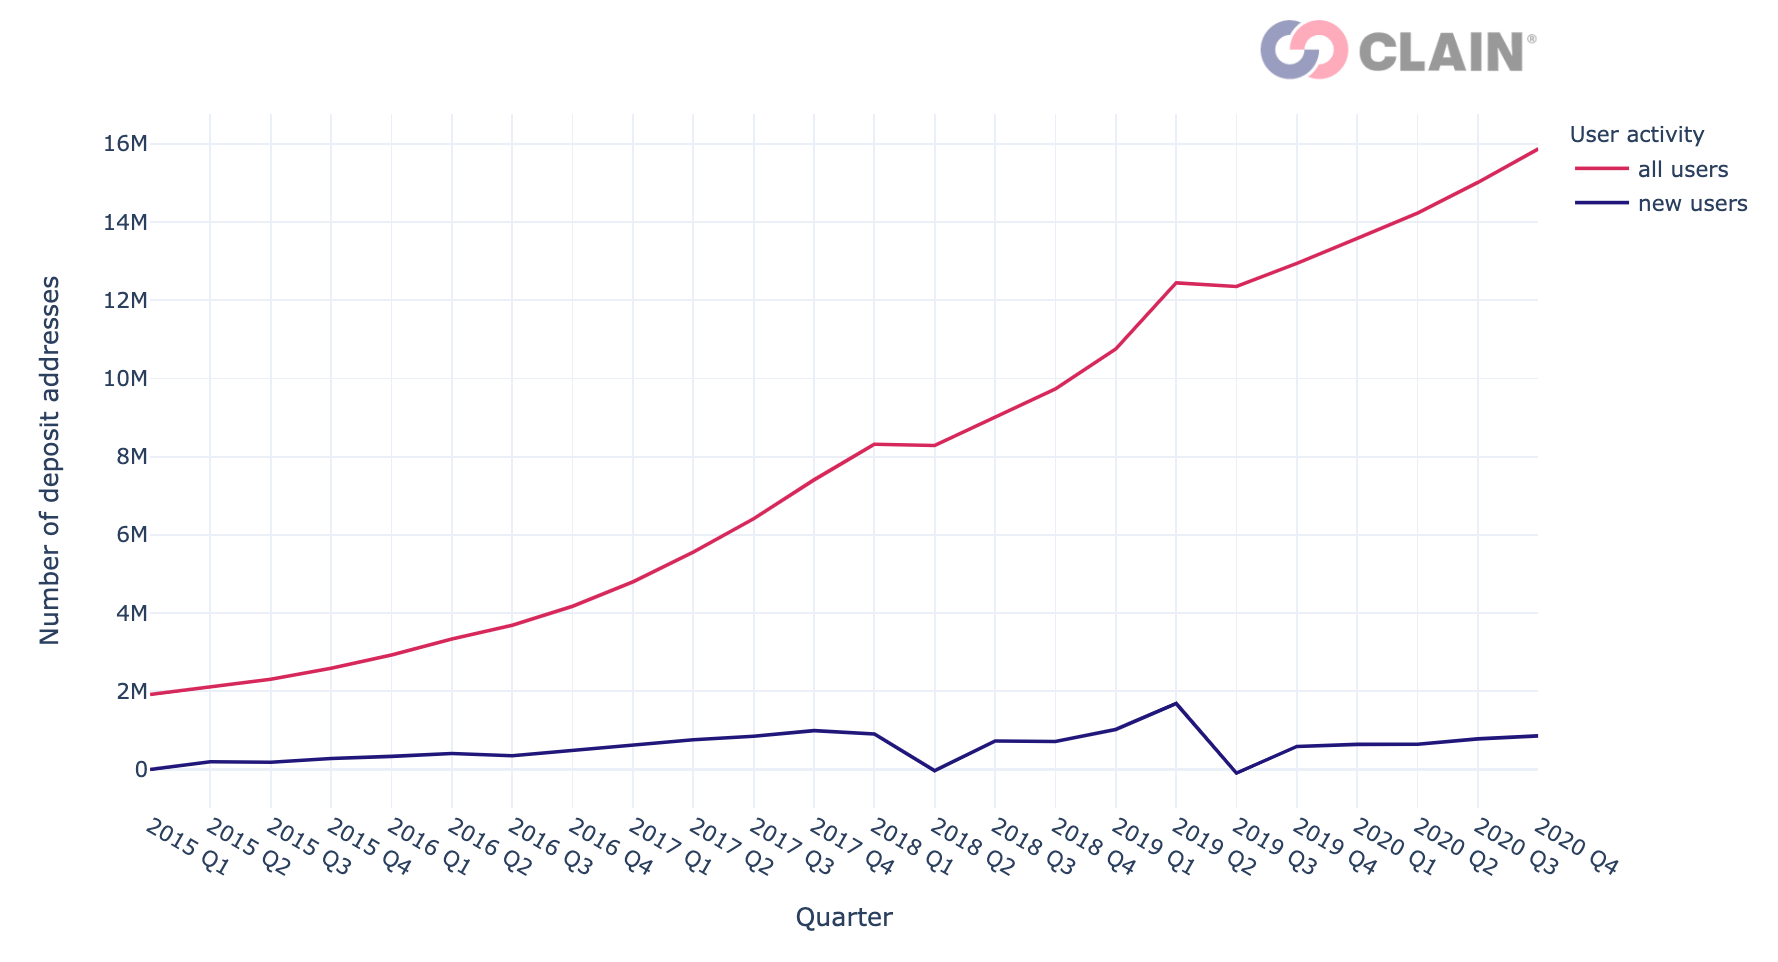
By the end of 2020, the user base of High-Risk Exchanges summed up to 16 million users. We define the number of users as the number of deposit addresses that an exchange has generated. As we can see from the graph below, both the number of High-Risk Exchanges and their user base have been increasing steadily over the past 5 years and is now showing the signs of stabilization
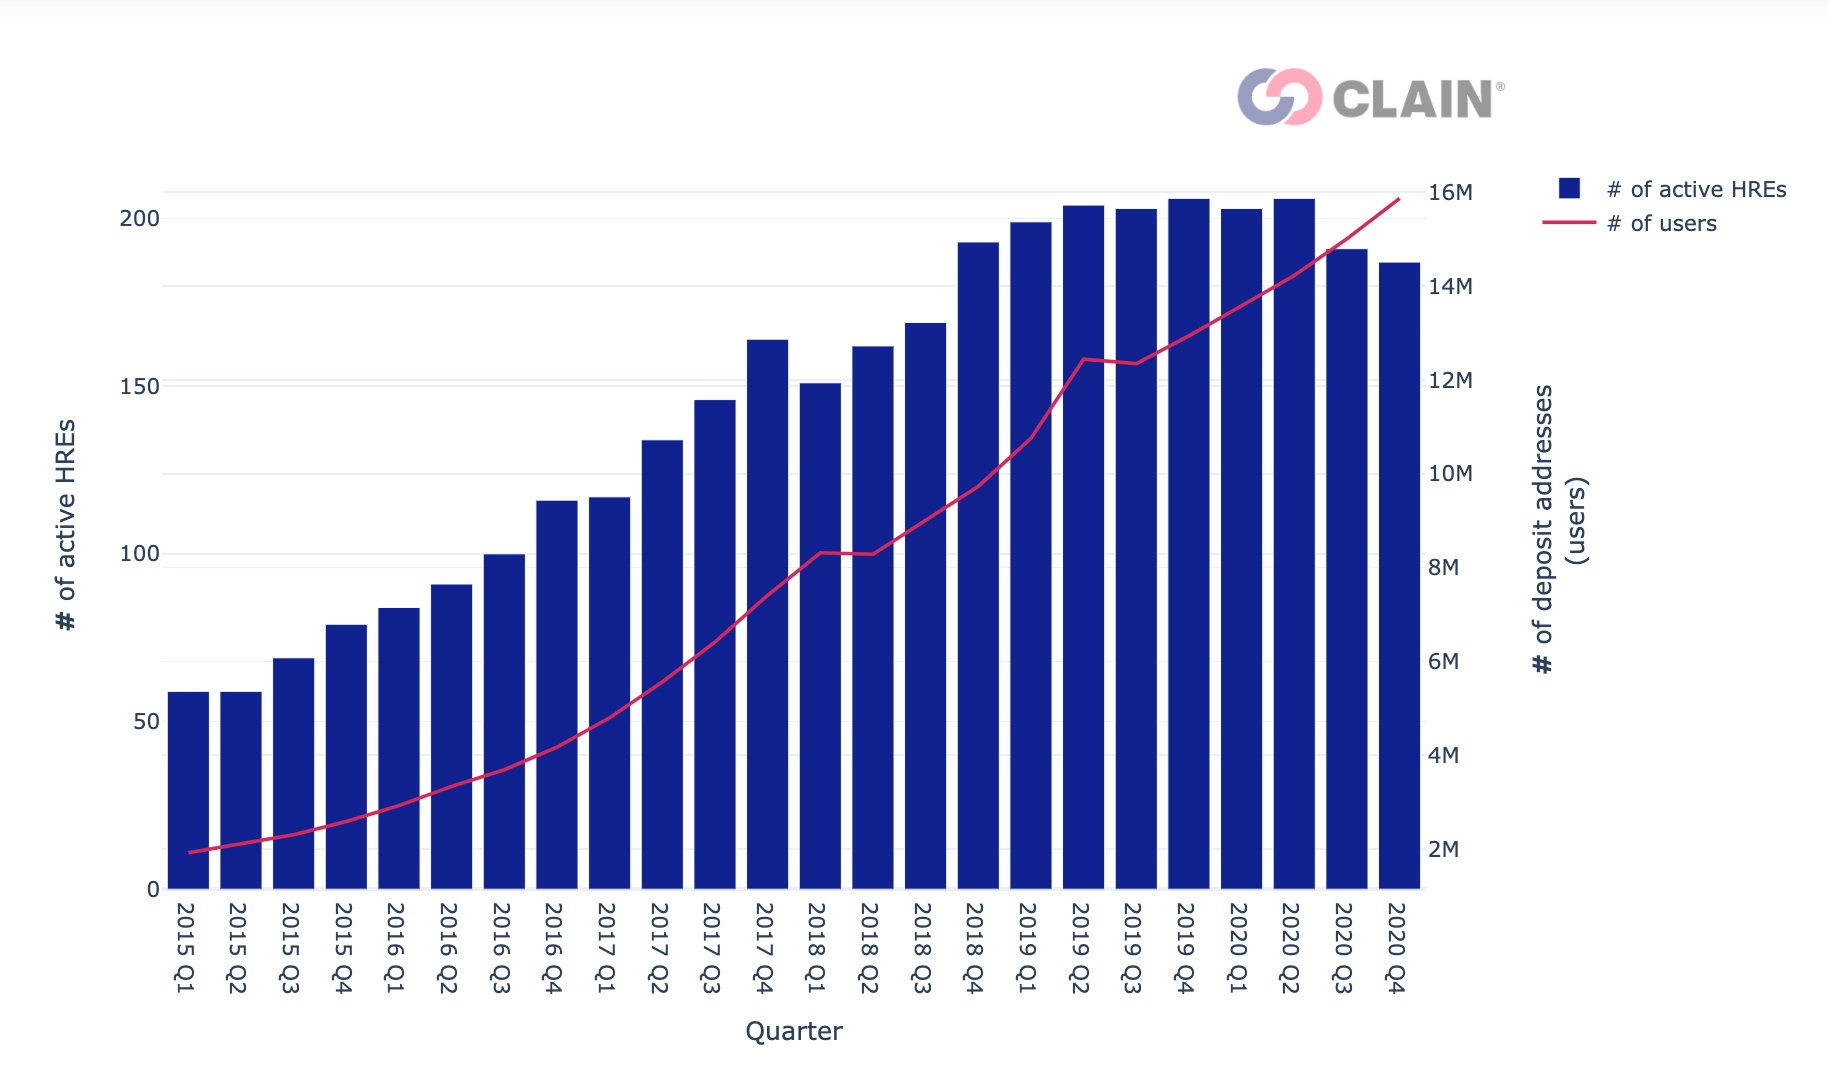
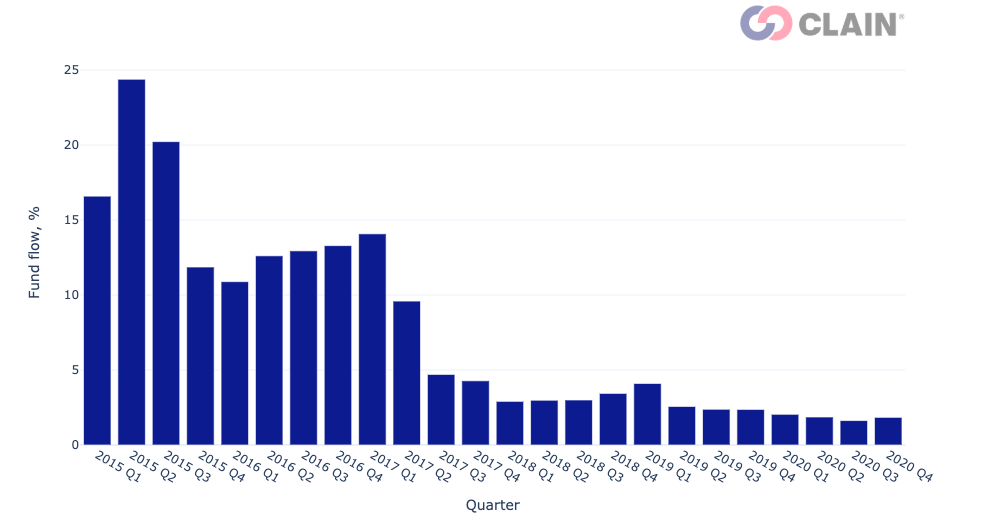
Despite the growth in the number of such exchanges, they process fewer funds in comparison with regular exchanges. Moreover, the share of funds processed by High-Risk Exchanges has been decreasing. This might be due to the rising regulatory restrictions for the services that offer an exchange of crypto assets.
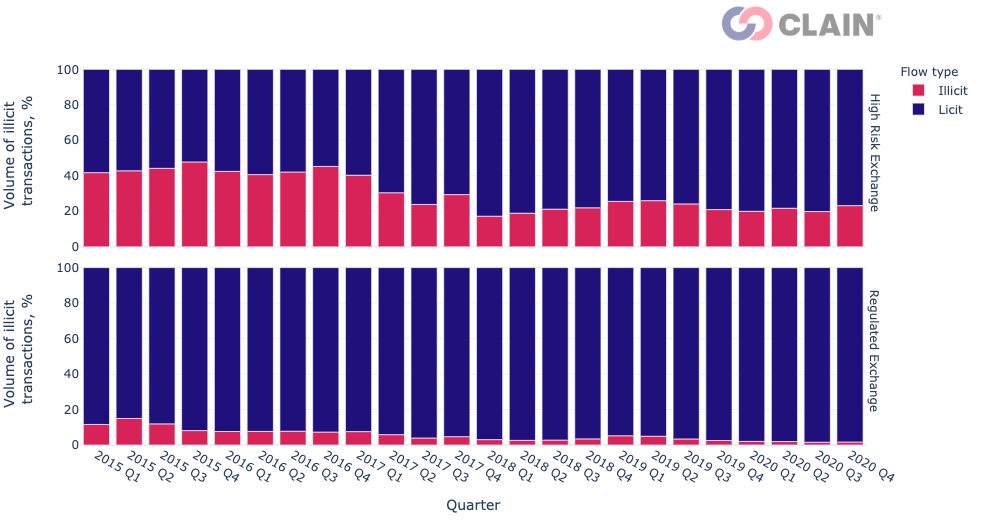
The core difference between regular exchanges and the high-risk exchanges lies in the share of illegal transactions that they process. Due to lower registration barriers for users, High-Risk Exchanges process 10 times more illegal transactions than exchanges with established KYC and AML policies. We wanted to look closely into the types of illegal activity performed through High-Risk Exchanges.
Illegal activity mediated by HREs
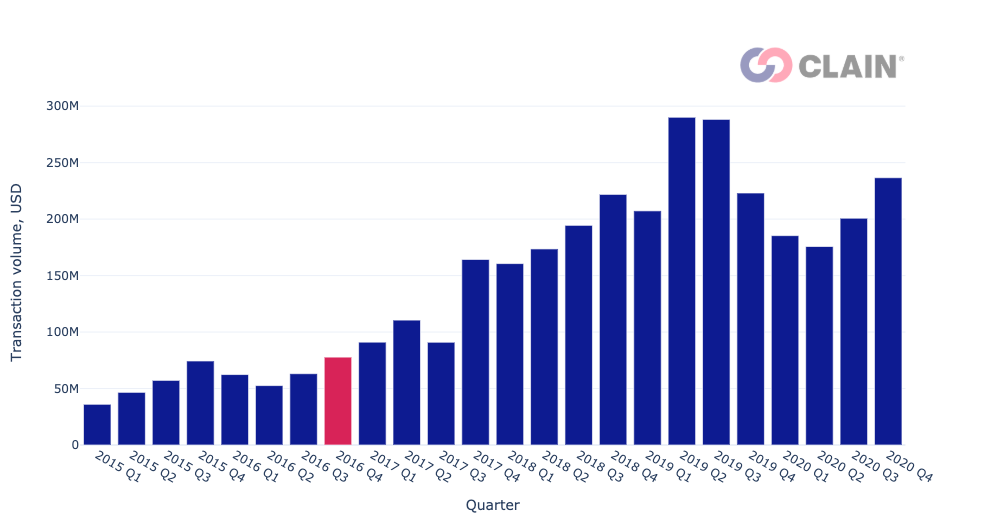
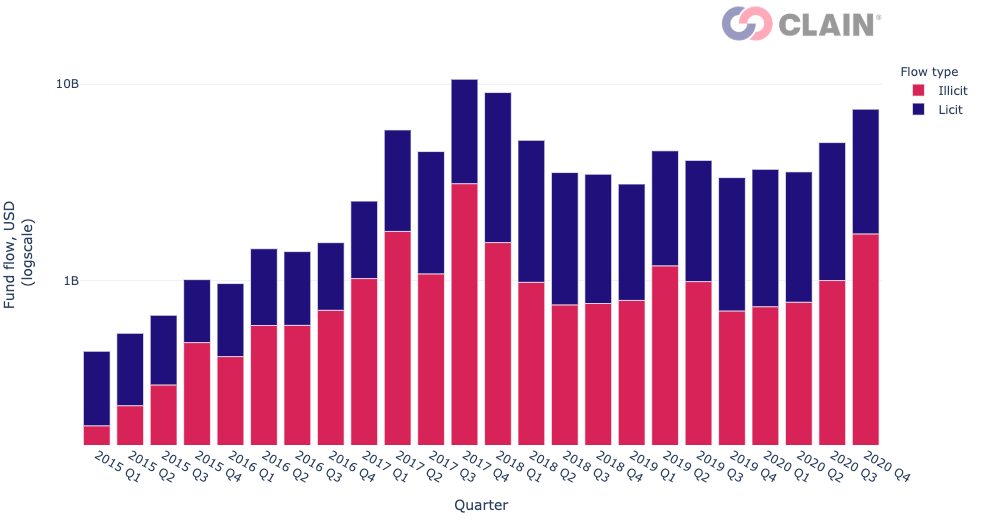
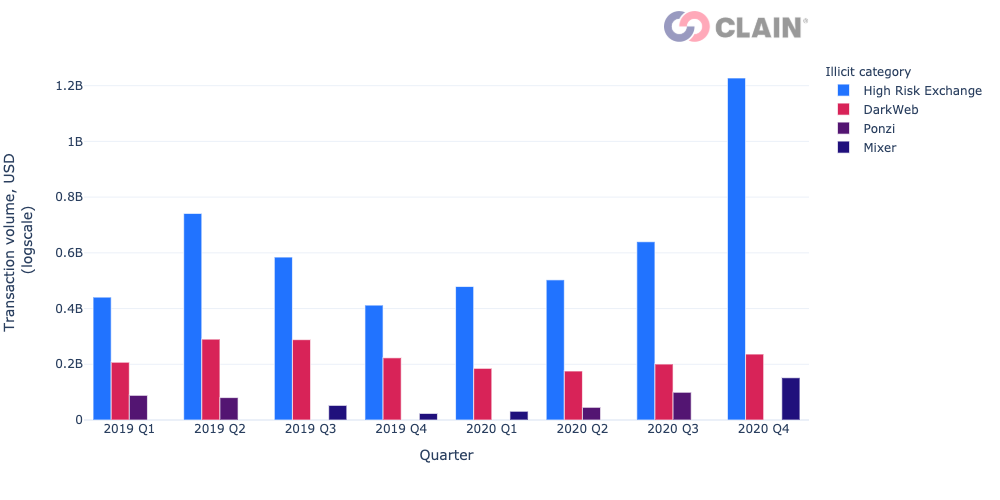
High-Risk Exchanges process at least 700 million dollars in illicit transactions each quarter. The trend has been steady since 2016 Q4.
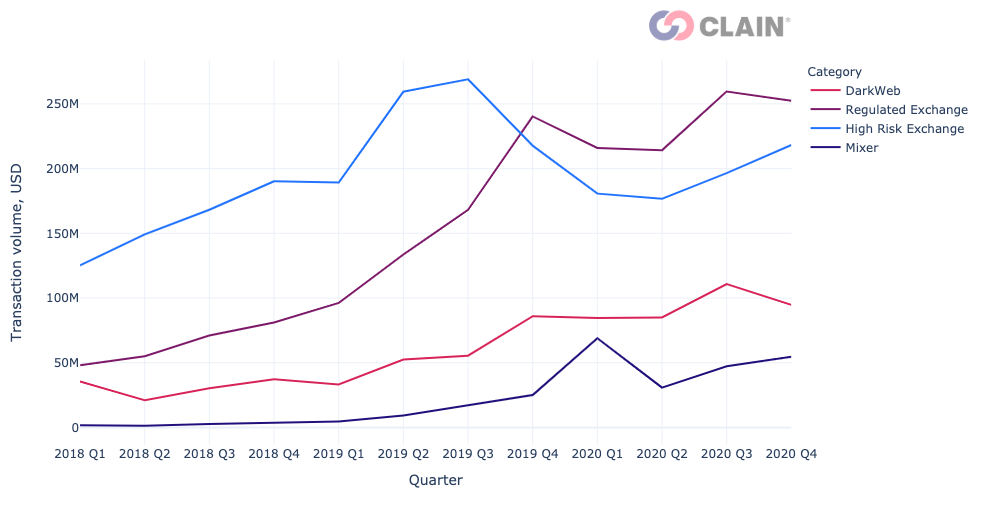
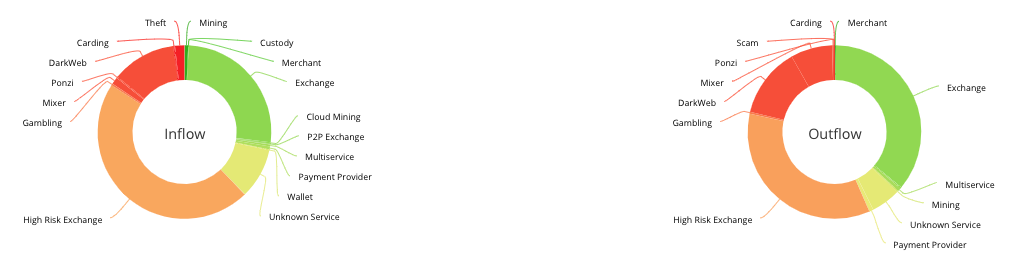
The most popular categories of illicit services that interact with High-Risk Exchanges include High-Risk Exchanges themselves, DarkWeb services, Ponzi schemes, Mixers, Carding shops, and Scams. Typically users prefer transfering funds from one HRE to another.
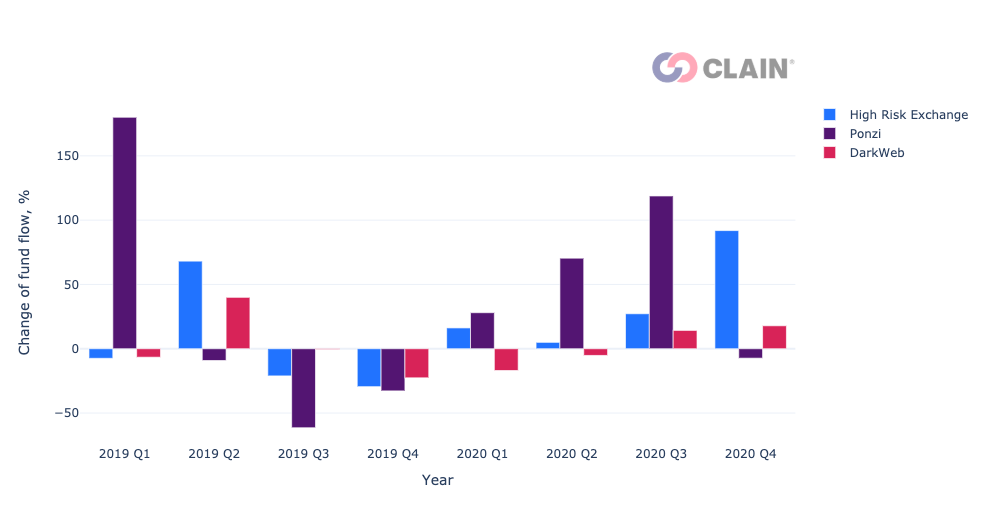
Looking at the percentage change of funds flow for top-3 most popular categories of HREs, we notice that Ponzi schemes have interacted more with High-Risk Exchanges.
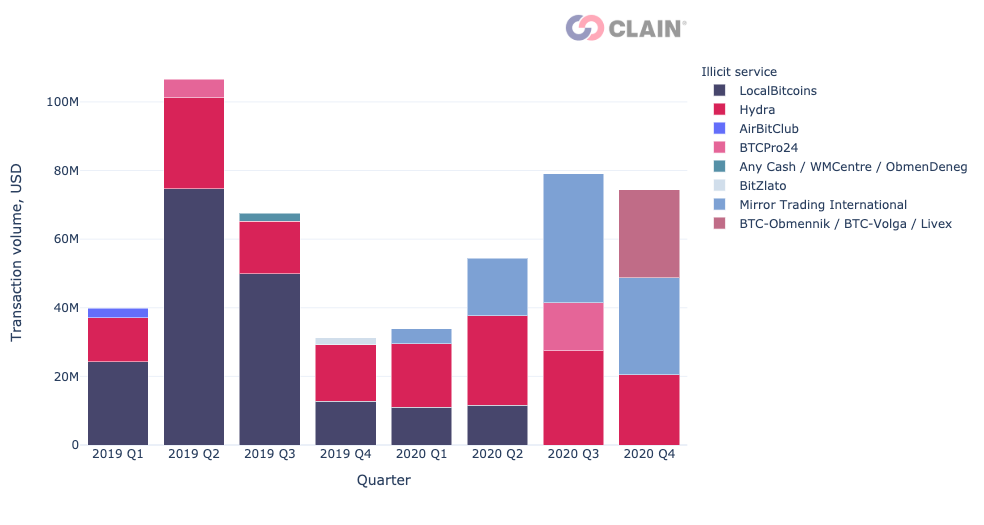
From the graph below, we illustrate how top counterparties of HREs have changed quarterly for the last couple of years. It appears that HRE users either send/receive the most funds to/from LocalBitcoins, Hydra, and Mirror Trading. We suppose that the decrease in transaction volume between HREs and LocalBitcoins may be related to the fact that LocalBitcoins has started enforcing AML/ KYC policies since the end of 2019.
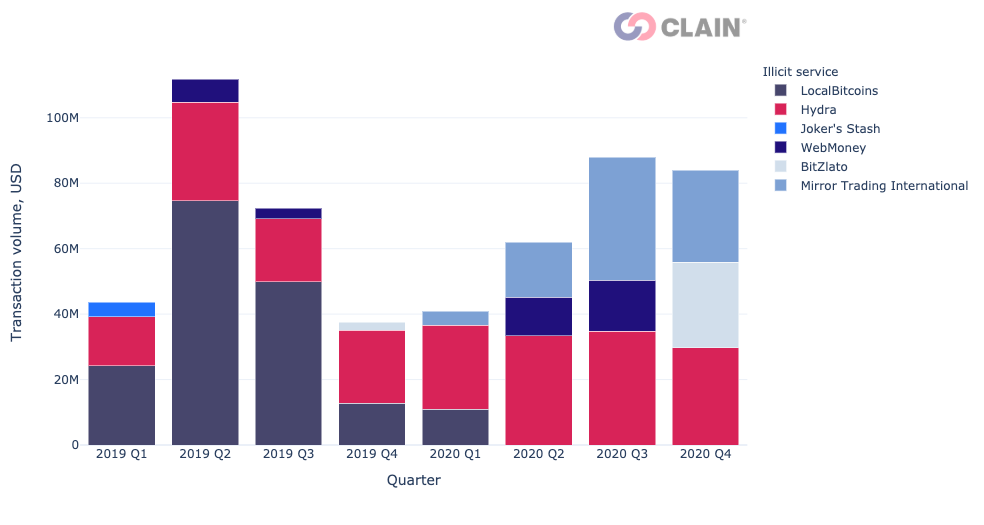
As for the incoming transactions of HREs, exchanges mainly receive funds from such services as BitZlato, WebMoney, and LocalBitcoins.
When it comes to outcoming transactions, the counterparties with the highest transaction volumes include Hydra, LocalBitcoins, and Mirror Trading.
What is Hydra and how are HREs related to it?

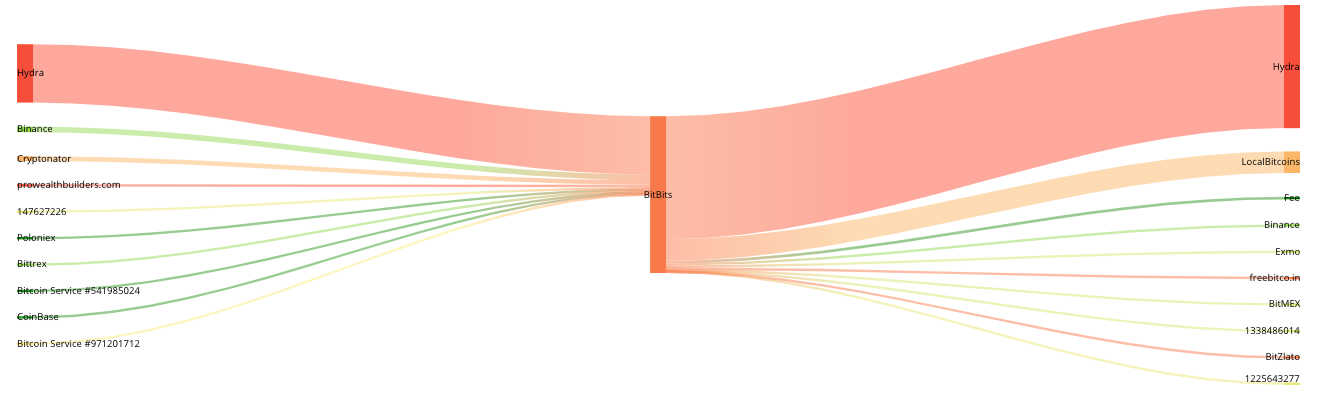
Hydra is the most popular DarkWeb marketplace in the world with its most users located in Eastern Europe. Among other features, our platform allows us to explore counterparties of a service and its related metrics. Below, we see that Hydra has both received and sent out most of its funds from/to such categories of services as High-Risk Exchange, DarkWeb, Carding, and Mixer.
As for the top direct counterparties, we see that Hydra’s top outflow counterparty is LocalBitcoins. A total volume of transactions that was sent from Hydra to LocalBitcoins is 413.2 million USD.
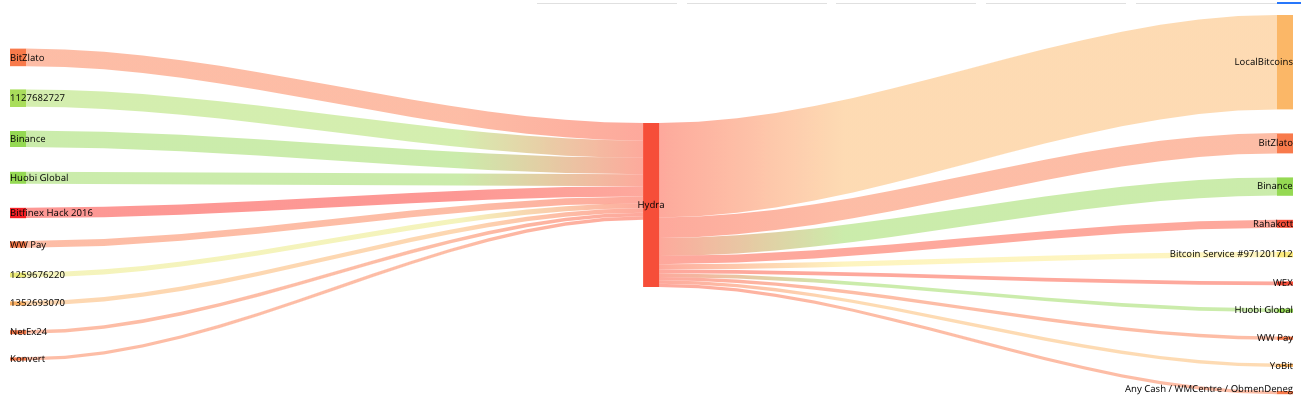
We have identified that there are several High-Risk exchanges that are marketed to be used by illicit services, either explicitly or implicitly. For example, one of such exchanges has exchanged most of its funds with Hydra. These types of services need to be investigated closer.
Interaction patterns of Hydra and High-Risk Exchanges
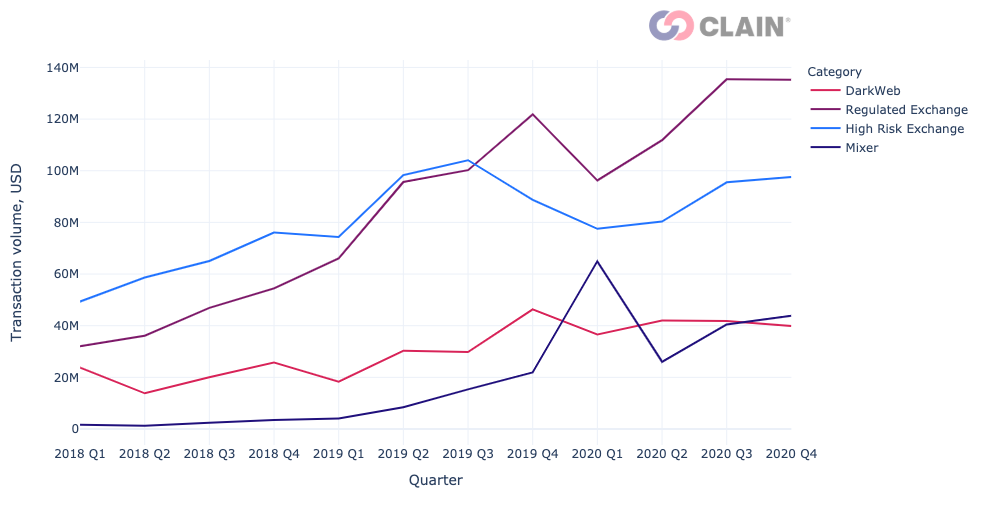
As Hydra is among the top counterparties of High-Risk exchanges, we wanted to explore how it is used by HRE users. We can see that mean transfers from Hydra to High-Risk Exchanges are higher than mean transfers from High-Risk Exchanges to Hydra.
If we look at median transfer amounts, we see that they are lower than the mean ones. However, the trend remains. Furthermore, despite the median transfer amounts for outcoming transactions are higher than for the incoming transfers, the overall volume of incoming transfers is 2.5 times higher than of the outcoming ones.
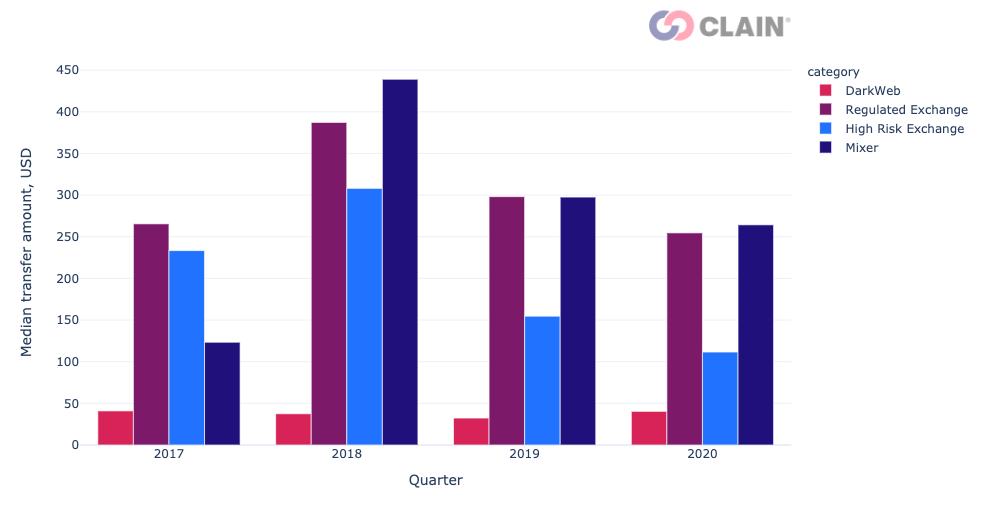
Median transfers for top-4 categories of Hydra counterparties are different. We can see that users of Hydra send to Mixers and trustworthy exchanges more than to DarkWeb services and HREs.
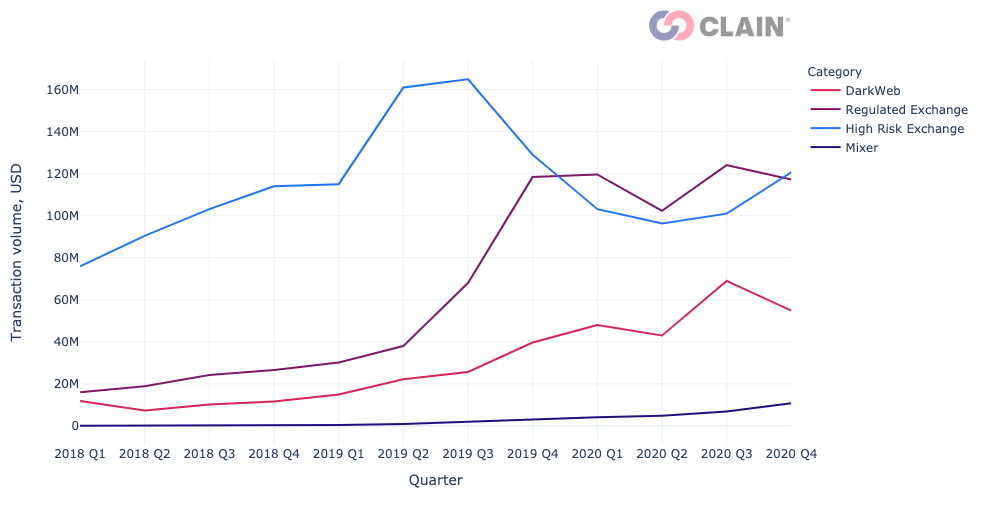
There is a trend that transactions from Hydra to other services are higher in transfer amount than incoming transfers to Hydra.
As for the transaction volume, we can see that High-Risk Exchanges process lower volumes of transactions from Hydra in comparison to regular exchanges. However, we already know that the share of illicit transactions for regulated exchanges is more than 10 times lower than for High-Risk exchanges.
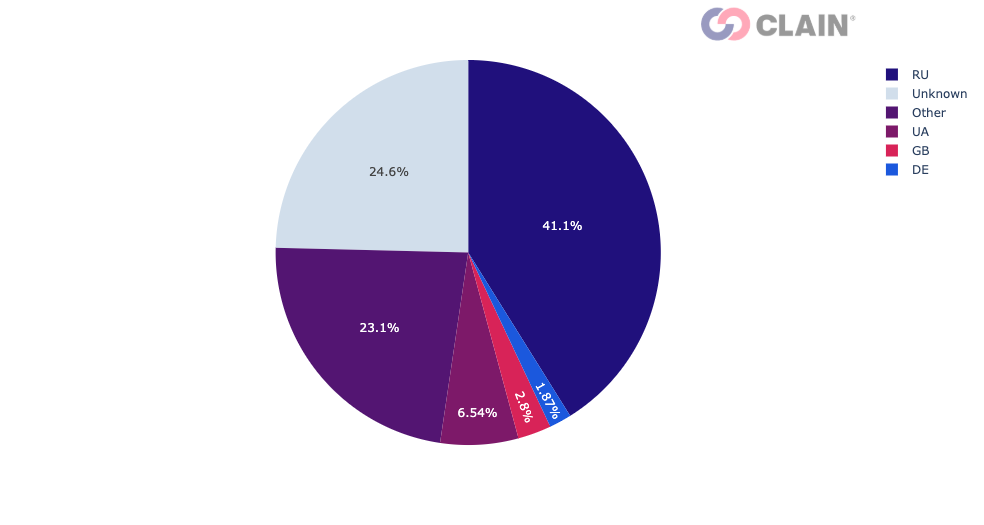
Distribution of Jurisdictions
We define the jurisdiction of a High-Risk exchange as the country where the exchange is registered. From the distribution below, Russia is leading in the top 5 list of the most popular jurisdictions both for Ethereum and Bitcoin. That may be related to the overall popularity of illicit services based in Russia such as Hydra.
Appendix: how we compute fund flow values
BTC, ETH and up to top 60 ERC20 tokens based on theirs capitalisation was included in a funds flow estimation.
For inflows and outflows, we consider indirect counterparties of a cluster. It means that if a cluster has received funds from an unknown cluster, we search deeper for an identified cluster. Consider the following chain of transactions: HRE1 -> Unknown Cluster 1 -> Unknown Cluster 2 -> Unknown Cluster 3 -> Hydra. Here, when we compute inflows of Hydra from HREs, we take into account the share of funds that Unknown Cluster 3 has received from the services of category ‘High-Risk Exchange’ via two other unidentified clusters. We think that a service is responsible for monitoring the sources of incoming funds and the target addresses of outcoming funds. Thus, we consider such cases when computing both the inflow and the outflow volumes. If we take into account only direct transactions, we specify that explicitly in the title of a graph as ‘direct (in/out)flow’.