-
Published
2019-10-14
-
Author
Clain Team
- Topics Market
- Share
Clain set to analyze bitcoin miners’ behavior to determine how mining activity has evolved within time and if bitcoin price has had any impact on miners’ behavior. By using Clain’s investigation and research platform, we looked back into history of miners’ funds flow to find correlation between their activity and the price action of bitcoin.
Miners
The definition of miners requires no introduction. Every crypto enthusiast knows that miners compete to produce new bitcoins by solving complex mathematical problems and, by verifying transactions, make blockchain network secure and trustworthy.
The competition among miners is all about how fast their computers can generate hashes. A decade ago, bitcoin miners could perform competitively on normal desktop computers until they realized that graphics cards (GPU), commonly used for video games, were more effective. The competition picked up further in 2013 when bitcoin miners began using ASIC chip designed specifically for mining cryptocurrency as efficiently as possible.
Mining Pools
In 2011, to handle competition effectively, a group of miners started to combine their computing power and split the mined bitcoins between participants. This is how mining pools have emerged.
We traced back the production of bitcoins from the very beginning to show you how mining pools have become dominant over time and how many bitcoins were mined monthly up to these days.
Surprisingly, it took less than a year for emerging mining pools to reach almost 50% share from zero. Even less time was required to push that share to a stunning 90% by August 2013. In the beginning of 2016, the mining pools amounted to as high as 99% of the total bitcoins produced – yet the share somewhat started to give up after 2016 halving.
As the dominance shifted away from individual miners, we focused on studying activity of the mining pools to get further insight.
Below we highlighted the top 5 mining pools and how their rank was altering quarterly throughout the history.
From the start to the end, a fierce competition did not allow any particular mining pool to hold on to the top positions for longer. Although few pools were able to stay in for a number of consecutive quarters.
To get the idea how mining pools managed their bitcoin reserves, we looked at how their interaction with exchanges took place, i.e. how many bitcoins the mining pools were sending to exchanges and how frequently they were transacting.
Below is the data we ended up with:
- BTC volume sent to exchanges
- Number of initiated transactions to exchanges
- USD value of transactions to exchanges
- BTCUSD price
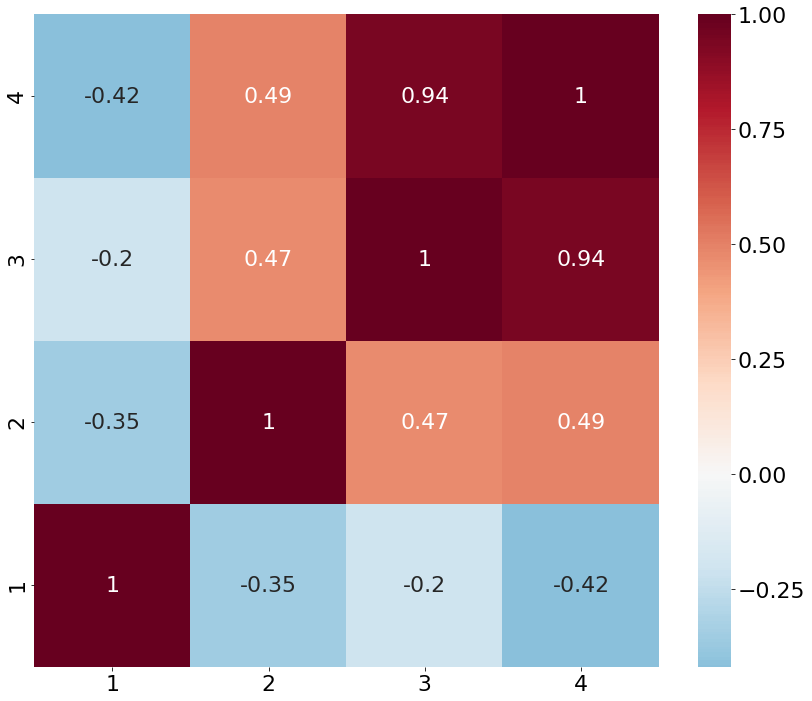
As we were curious to find any support to commonly held belief that BTC price action is driven by miners’ behavior, the actual data in fact has revealed the correlation is not statistically significant.
The only sizable correlation that we were able to detect, was a correlation between USD value of flows and the BTC price. But this is where it gets tricky. The USD flow variable is a derivative of BTC price, so it factors in a huge deal of BTC price itself and thus shall not stand for a fair relationship. Dismissing that strong correlation, we are left with no interesting insight.


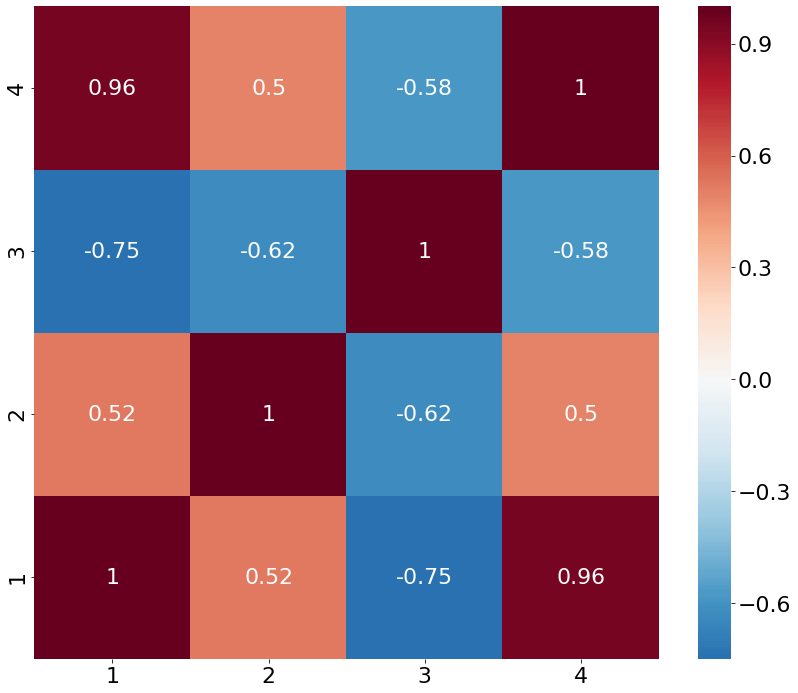
After massaging the data by eliminating high frequency fluctuations (noise) using Fourier transformation, we looked at these variables’ correlation again, but failed to see drastically different outcome.

An interesting point to note though is a timeframe between 2016 and 2017 where all the variables were positively related. But as the price of the bitcoin was heading up to the epic top, this relationship was getting broken.
We have also estimated the mining pools’ aggregate balance – the difference between bitcoin production and transfers to exchanges. The chart indicates a strong growth in mining pools reserves despite dramatic price movements in bitcoin.